Module of statistics...
In order to analyse your data and to have a better insight of the distribution, you may want to display some elementary statistics about your data. Therefore you can use the stats module.
To display the statistics of your data, you can either:
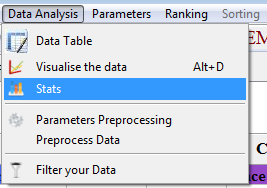
- go to Menu --> Data Analysis --> Statistics (LEFT)
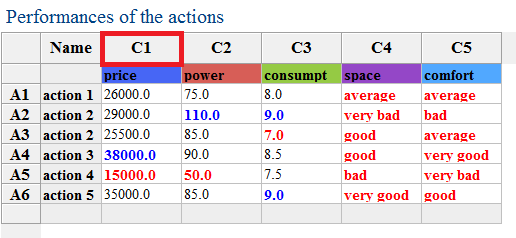
- double click left on the label (top) of the column of your table (RIGHT)
 |
 |
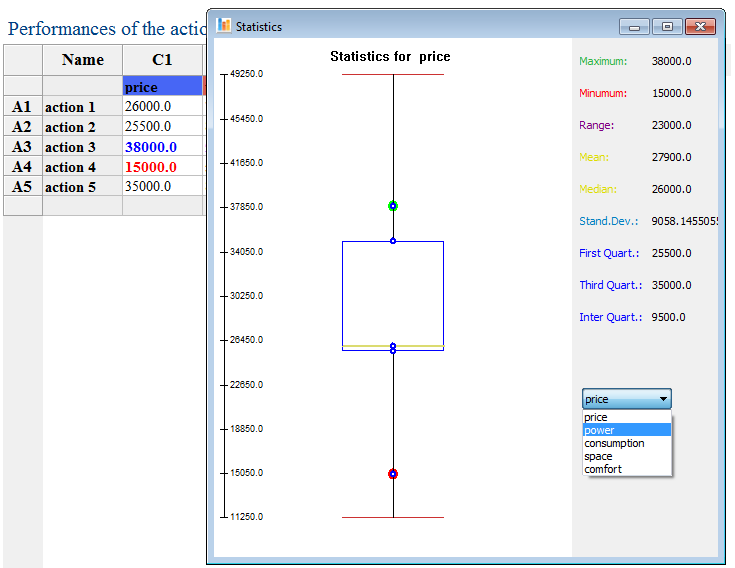
Display of the statistics of the price:

You can easily go from one criterion to another criterion. As displayed, the statistics module gives you:
- the maximum value
- the minimum value
- the range (the difference between the maximum and the minimum)
- the mean or the average value
- the median (the middle value if all the values are ordered from the highest to the lowest: 38 000, 35000, 26 000, 25500, 150000)
- the standard deviation (gives you an idea about the spreading of your values ; the higher this value, the more spread your values)
- First quartile: gives the value which is higher than 25% of the population - so 75% of the population is higher than this value.
- Third quartile: gives the value which is higher than 75% of the population - so 25% of the population is higher than this value.
- The BOX plot is made with the first and third quartile: this box (blue rectangle) contains 50% of all the data. Eveything outside the moustaches(peaks of the box) is considered as an outlier.
- Interquartile: difference between the Third quartile and the First quartile