In this page, you will learn
how to:
- The
Menu
Bar
- Files
- Problem
- Data Analysis
- Parameters
- Ranking
- Export 2 File
- Window
- The
Tool Bar
1.
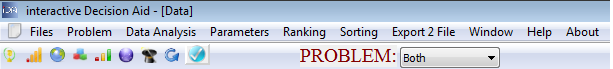
The Menu Bar
The
following menus may be
accessed:
- Files
- Problem
- Data Analysis
- Parameters
- Ranking
- Export 2 File
- Window
1.
Files
|
Short
Cut |
Legend |
Result |
 |
Ctrl+O |
Open |
Opens
an existing
decision problem |
| Ctrl+N |
New |
Creates a new problem
with a blank spreadsheet |
| Ctrl+S |
Save |
Saves your problem in
the current file. |
| Ctrl+M |
Save
as |
Saves your problem in a
new file. |
| Ctrl+N |
Close
File |
Closes your problem. |
| Alt+F4 |
Close |
Closes the iDA program. |
2. Problem
|
Short
Cut |
Legend |
Result |
 |
Alt+A |
Add
Action |
Adds an action to your
problem. (*) |
| Alt+C |
Add
Criterion |
Adds a criterion to your
problem.
(*) |
| Alt+Shift+A |
Delete
Action |
Deletes the last action.
(**) |
| Alt+Shift+C |
Delete
Criterion |
Deletes the last
criterion.(***) |
| Alt+N |
New
Problem |
Permits you to define,
step
by step, a new problem. |
| Ctrl+N |
New
Spreadsheet |
Opens a new Spreadsheet. |
| / |
/ |
Permsits to save some
information about the user, date,
etc. of your problem. |
(*) : You can enter directly an action or a
criterion from your spreadsheet: click on the last lign on the
"Down Arrow" for
adding
a new action ; and in the last column
"Alt+Arrow Righ"
to
add a new criterion.
(**) : To delete a particular action, click right on the
cell of the action in the first column.
(***) : To delete a particular criterion, click right on the
cell of the criterion
in the first row.
3. Data Analysis
 |
Legend |
Result |
| Data
Table |
Displays the performance
table in a new window. |
| Visualise
the data |
Displays a graphical
representation of the performances
of the actions. |
| Stats |
Displays statistics
about the performances of the
actions. |
| Parameters
Preprocessing |
Displays the parameters
of the preprocessing. |
| Preprocess
Data |
Preprocesses your data. |
| Filter
your Data |
Displays the filtering
parameters. |
4. Parameters
 |
Legend |
Result |
| Parameters
of the criteria |
Show the parameters of
the criteria. |
| Shows
the Weights |
Shows
the weights of the
criteria. |
| Tile
Weights in new Frame |
Shows the weights of the
criteria in a new window. |
5. Ranking
 |
Shortcut |
Legend |
Result |
| F6 |
Ranking |
Displays the
net ranking
scores of the actions. |
| F5 |
Ranking
Charts |
Displays the ranking
charts (graphical representation)
of the actions. |
|
Criterion
Net Flows |
Displays the net scores
for each criterion. |
|
Positive
Flows |
Displays the positive
scores of the actions. |
|
Negative
Flows |
Displays the negative
scores of the actions. |
|
All
Flows |
Displays the net,
positive and negative scores of the
actions. |
|
Preference
Matrix |
Displays the preference
matrix: a pairwise comparisons
between the actions |
|
Incomparability
Matrix |
Displays
the pairwise
incomparabilities. |
|
|
Binary
Preference Matrix |
Displays the pairwise
binary preference relations
between the actions. |
|
|
Stats
Net Flows |
Displays some statistics
about the net flows. |
|
F8 |
Gaia
Map |
Displays the
Gaia Map |
|
F3 |
Improve
an action |
Displays
a
menu to increase the performances
of an action (Sensitivity Analysis) |
6. Sorting

|
Shortcut |
Legend |
Result |
|
Type
of Profiles |
Choose the type of
profiles which define the categories: limiting open profiles, limiting
closing or central
profiles. |
| Alt+P |
Add
Profile |
Add a profile to the
list. |
| Alt+Shift+P |
Criterion
Net Flows |
Delete last profile. |
|
Sorting
Classes |
Displays the groups of
each action. |
|
Sorting
Charts |
Displays the
score of each action. |
|
Action
-vs- Profiles |
Displays an action in
regards of solely the profiles. |
|
Detailed
scores |
Displays detailed
scores: unicriterion
flows, negative, positive and net flows. |
|
Sorting
report
|
Displays a small report
about the assignments. |
|
CTRL+F8 |
Gaia
Map |
Displays the FS-GAIA map. |
|
CTRL+F3 |
Improve
an action |
Displays a menu to
increase the performances
of an action (Sensitivity Analysis) |
7. Export 2 File
 |
Shortcut |
Legend |
Result |
| Ctrl+E |
Export
2 File |
Permits you to export
your data and results to a pdf or
csv file. |
| Ctrl+I |
Export
2 Image |
Permits you to export
your screen to a file. |
8.
Window
 |
Legend |
Result |
| Cascade |
Permits you to undock
all the windows. |
| Tile
Horizontally |
Will dock all your
windows
by divising your screen
horizontally. |
| Tile
Vertically |
Will dock all your
windows by divising your screen
vertically. |
| Arrange
Icons |
Arranges the icons of
your windows directly. |
| Next |
Selects the next window. |
| Previous |
Selects the previous
window. |
2.
The Tool Bar:
 |
Gives the Ranking Scores
in a table. |

|
Gives the Ranking
Charts, i.e. a graphical
represenation of the ranking |
 |
Displays the Gaia Map,
i.e. a graphival
representation
of your ranking problem. |
 |
Gives the groups and
scores of each action. |
 |
Gives the Sorting
Charts, i.e. a graphical
represenation of the sorting. |
 |
Displays the FS- Gaia
Map, i.e. a graphival representation
of your sorting problem. |
 |
Launch the wizard. |
 |
Force
an automatic
update of all the results. |
  |
Disables \ Enables the
automatic update of the results. |